In the video, I first open a PowerPoint document that contains a Flash model (blue data points and play button). After starting a slide show, the play button allows me to spin data points around a 3D ball (rotating text "ESPOO" is the name of my home town).
How did I do it? See the following flowchart about the Xcelsius development process (the Flash model of course works in a browser too).

You always build an Xcelsius model based on an Excel spreadsheet. If I simplify it a little, some Excel cells are input cells (in Xcelsius, you make play buttons, sliders, check boxes, radio buttons, combo boxes, or text boxes to change their values) and some are output cells (in Xcelsius, you create charts using those).

The method of using Excel and Xcelsius together means that you end up having specifications in two places. The larger the Xcelsius model grows, the more dependencies you have between the two. Adding a third component--online database access to Excel--is possible as well. As I so far don't know the best practice to build a large Xcelsius model, I consider you rather build several independent small Xcelsius dashboards instead of a combined one.
To finally show how I created the 3D demo, below you can see the Excel speadsheet. Original data points are in B13:C62 (for example lines 13 to 25 draw the letter "E"). Cells I13:J62 are output cells for the XY chart. B5 is the input cell for the Play button.

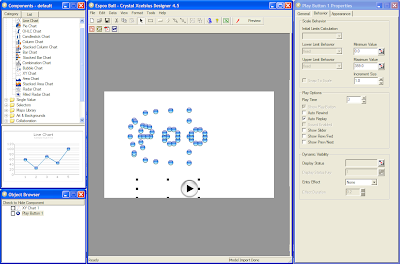
The following image shows Crystal Xcelsius in the designer mode. The Play button is commanded to increase its value from 0 to 359 degrees continuously (auto replay selected).

4 comments:
Hi Janne,
Most interested in your 3D espoo ball trick.
What is the way of creating an Excel worksheet with that kind of data.
Secondly can you please share the xlf file and the excelsheet.
Hello Dev,
Please send me email, so I reply to you and attach the files.
Regards, Janne
Hi Janne,
Wow! I came across this site accidently. I'm impressed with this trick. I know this is a old post, but is it possible for you to share the xlf file and excel sheet? My email id is vimal3894@gmail.com
Thanks,
Vimal
Hi Janne,
ver-very exciting dashboard. If it possible, can you send me xlf example, how can I made such dashboard.
My email kimandreyv@gmail.com
Thank you!
Post a Comment