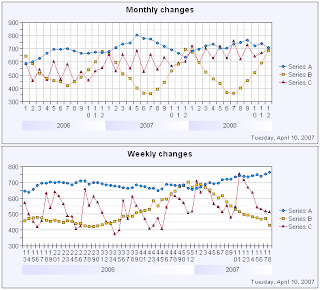
Let's start with the following two graphs. (All report objects are created with the Voyant tool. Other charting tools allow you to do corresponding graphs.)

NOTE: Series A, B, C (etc) are general placeholders for your business data--they represent any phenomena compared over time such as actual vs. budget vs. forecast, sales vs. costs, revenues by operating segment or geographic region, capacity vs. actual and planned production, etc.
These simple graphs display twelve months (52 weeks) in the year chosen from the menu above the chart. Good point: the charts are simple. Bad point: you cannot easily track changes that extend to two years or more.
To enhance the charts, let's move the year dimension into the category axis.

Now you see changes over longer periods of time (good), but the graph contains too many years--11 years!--to help you easily observe changes that are happening right now (bad).
To provide more space for the category axis, you need to limit the amount of data. It's a good idea to use selection criteria such as date >= 1st January 2006. However, using a fixed date in criteria is not good--it's better to create dynamic date criteria such as date >= 1st January previous year or date >= 1st day of current month previous year. Additionally, you often want to limit dates in the future using date <= last day of the next year or something similar. Let's see how the graphs are enhanced.

As we now live April 2007 (current date printed in the bottom-right corner of the graph), it's easy to see actual and forecasted changes at a glance.
Of course it's up to your business what is the relevant period and frequency of data: previous-current-next year, last 12 months, or something else? Monthly, weekly, or daily data? Generally it's ok to watch about 50-100 data points spread on the date axis as soon as the software presents them clearly. This equals to about 8 years of monthly data, 1.5 years of weekly data, or 3 months of daily data, such as in the following image.

Nevertheless more than hundred data points are well possible, if the software provides a date axis that scales dynamically. See the following Voyant charts with 261 weekly values (5 years, each data point in Thursday) and 396 daily values (last 12+1 months)--a lot of data but very clear. The software allows you to check the exact date by moving a mouse cursor onto a line.

Technically, it depends on the database how to create dynamic date criteria and other issues discussed above. The following examples show some methods. Feel free to use and enhance them in your own projects.
In Oracle:
- Dates after first day of this year: WHERE date >= TRUNC(SYSDATE,'YYYY')
- Dates after first day of previous month: WHERE date >= TRUNC(ADD_MONTHS(SYSDATE,-1),'MM')
- Dates between previous year and next year (three years): WHERE date BETWEEN TRUNC(SYSDATE-365,'YYYY') AND TRUNC(SYSDATE+2*365,'YYYY')-1
- Dates during the last 12 months (including this month previous year): WHERE date BETWEEN TRUNC(ADD_MONTHS(SYSDATE,-12),'MM') AND TRUNC(ADD_MONTHS(SYSDATE,1),'MM')-1
In ODBC (SQL Server, MySQL, and many others):
- Dates after first day of this year: WHERE date >= {fn TIMESTAMPADD(SQL_TSI_DAY,-{fn DAYOFYEAR({fn CURDATE()})}+1, {fn CURDATE()})}
- Dates after first day of previous month: WHERE date >= {fn TIMESTAMPADD(SQL_TSI_DAY,-{fn DAYOFMONTH({fn TIMESTAMPADD(SQL_TSI_MONTH,-1,{fn CURDATE()})})}+1, {fn TIMESTAMPADD(SQL_TSI_MONTH,-1,{fn CURDATE()})})}
- Dates between previous year and next year (three years): WHERE date BETWEEN {fn TIMESTAMPADD(SQL_TSI_DAY,-{fn DAYOFYEAR({fn TIMESTAMPADD(SQL_TSI_DAY,-365,{fn CURDATE()})})}+1, {fn TIMESTAMPADD(SQL_TSI_DAY,-365,{fn CURDATE()})})} AND {fn TIMESTAMPADD(SQL_TSI_DAY,-{fn DAYOFYEAR({fn TIMESTAMPADD(SQL_TSI_DAY,2*365,{fn CURDATE()})})}, {fn TIMESTAMPADD(SQL_TSI_DAY,2*365,{fn CURDATE()})})}
- Dates during the last 12 months (including this month previous year): WHERE date BETWEEN {fn TIMESTAMPADD(SQL_TSI_DAY,-{fn DAYOFMONTH({fn TIMESTAMPADD(SQL_TSI_MONTH,-12,{fn CURDATE()})})}+1, {fn TIMESTAMPADD(SQL_TSI_MONTH,-12,{fn CURDATE()})})} AND {fn TIMESTAMPADD(SQL_TSI_DAY,-{fn DAYOFMONTH({fn TIMESTAMPADD(SQL_TSI_MONTH,1,{fn CURDATE()})})}+1, {fn TIMESTAMPADD(SQL_TSI_MONTH,1,{fn CURDATE()})})}
In Oracle:
- Year: TO_NUMBER(TO_CHAR(date,'YYYY'))
- Month: TO_NUMBER(TO_CHAR(date,'MM'))
- Year (when used with ISO standard week): TO_NUMBER(TO_CHAR(date,'IYYY'))
- Week, ISO standard starting on Monday: TO_NUMBER(TO_CHAR(date,'IW'))
- Day of month: TO_NUMBER(TO_CHAR(date,'DD'))
- Date as such: date
- Week (as a date value of Thursday = the middle day of week): date-TO_NUMBER(TO_CHAR(date,'D'))+4
In ODBC (SQL Server, MySQL, and many others):
- Year: {fn YEAR(date)}
- Month: {fn MONTH(date)}
- Year (when used with ISO standard week): {fn YEAR({fn TIMESTAMPADD(SQL_TSI_DAY,-{fn MOD({fn DAYOFWEEK(date)}+5,7)}+3,date)})}
- Week, ISO standard starting on Monday: {fn FLOOR(1+({fn DAYOFYEAR({fn TIMESTAMPADD(SQL_TSI_DAY,-{fn MOD({fn DAYOFWEEK(date)}+5,7)}+3,date)})}-1)/7)}
- Day of month: {fn DAYOFMONTH(date)}
- Date as such: date
- Week (as a date value of Thursday = the middle day of week): {fn TIMESTAMPADD(SQL_TSI_DAY,-{fn MOD({fn DAYOFWEEK(date)}+5,7)}+3,date)}
Happy charting :)
2 comments:
Hi Jane:
I just discovered your page and have found it very interesting.
Here's a link to a day of year chart that shows data for comparable periods.
link
This approach can be helpful if you have several years of trend data that you'd like to compare.
Thanks for the feedback, Kelly. The link was well worth visiting and gives me ideas what kind of posts would be valuable. BTW, my name is Janne = typical Finnish male name. :)
Post a Comment